
The Misery Index — the combination of Inflation and unemployment — failed as a bearish criticism of the economy. Unemployment remains at 60-year lows, and Inflation has plummeted from 9% down to the 3s.
If you have a bearish mindset, and seek confirmation of that perspective, then the next economic critique after the Misery Index you try on for size is “Stagflation.” We have heard the S-word from Jamie Dimon, Stanley Druckenmiller, Bank of America, Barclays, Fox, Marketwatch, Kiplingers, and many others.
The definition from the 1970s + ’80s was the combination of slow growth, high unemployment, and rising inflation. But if Stagflation is your reason for being negative, you run into a similar problem: Growth has been robust, unemployment low, and inflation is way below its June 2022 highs.
Like so much of the “If it bleeds it leads” media, there is far less to this scary threat in the data than advertised.
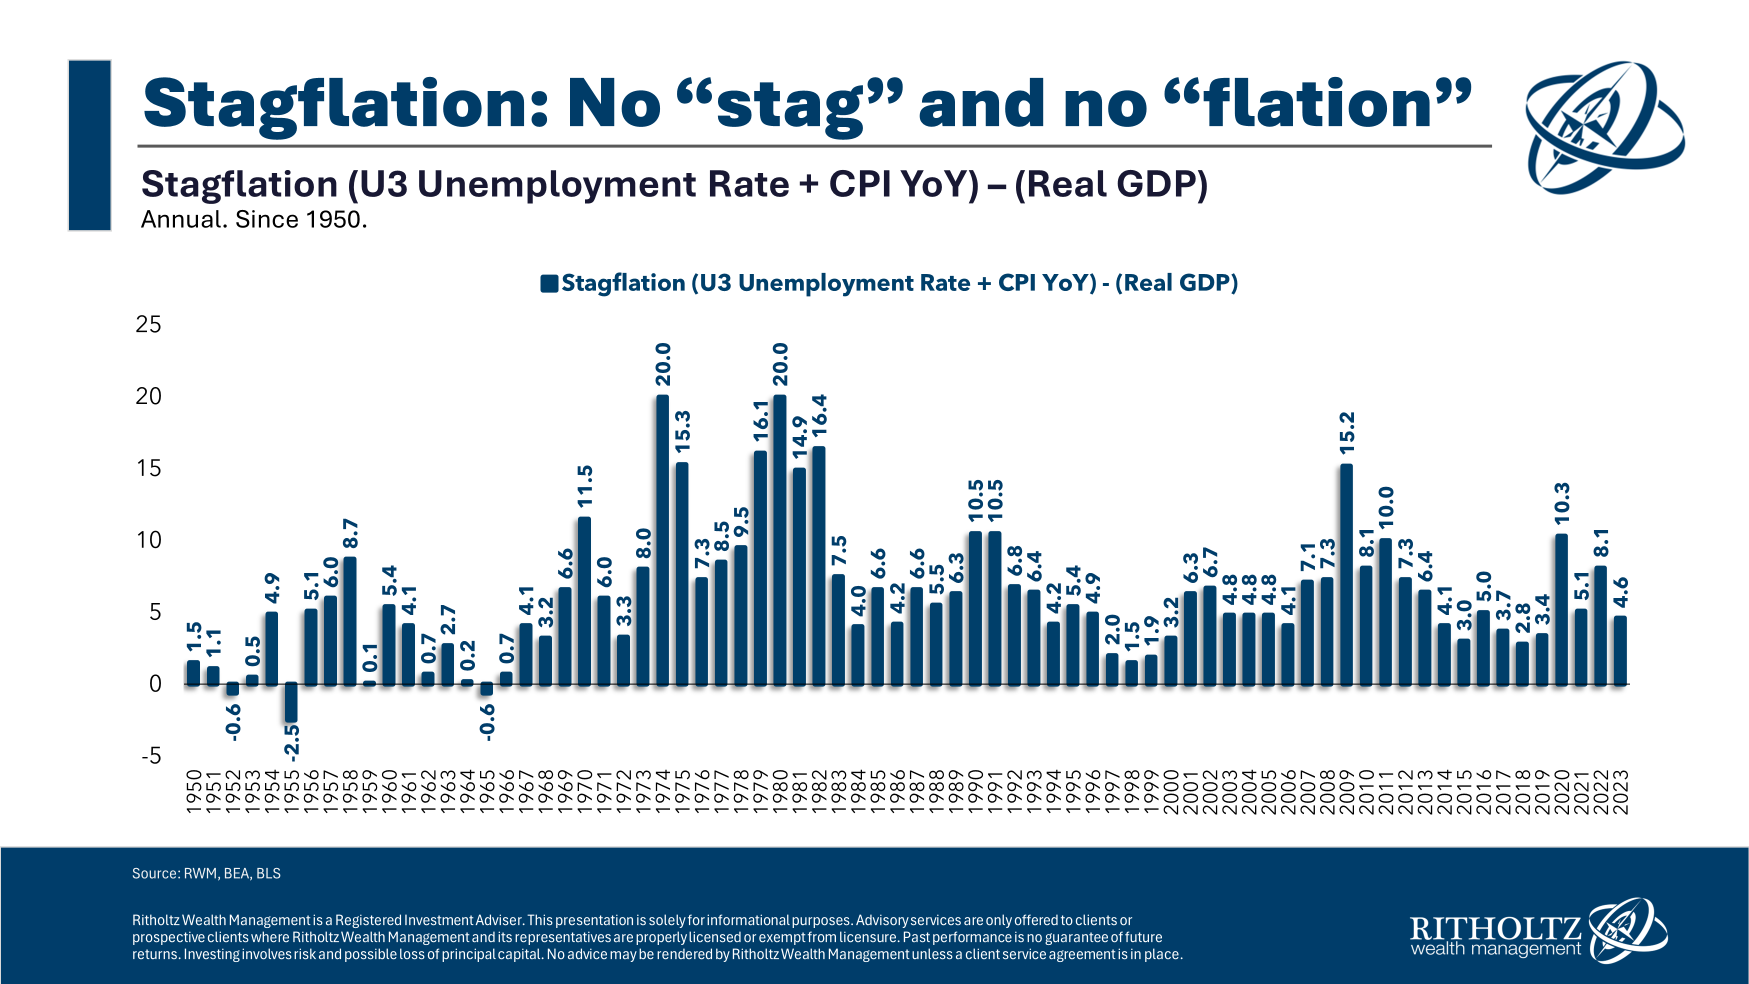
The United States has had bouts of Stagflation in the past. We created a STagflation bar chart using a simple formula:
Stagflation = Unemployment (U3) + CPI Inflation (Year over Year) – Real GDP
As the chart above shows, Stagflation ticked up in the early 1970s, spiking to 20 in 1974, and stayed elevated for most of the decade. It hit those high levels again in 1980 and stayed high until Inflation was vanquished by then-Fed CHair Paul Volcker and the economy recovered in earnest after 1982. The economic collapse during the GFC sent this back over 15 briefly and spiked again during Covid over 10.
Today, levels of stagflation are the same as in the 1990s or the GFC 2000s. It’s another economic worry that — at least as of now — is not backed up by any data…
Or as Bank of America observed today: “Stagflation was so 2022.” After a soft Q1 GDP, and lagging (blame OER) inflation, they note the “stagflation” narrative has resurfaced. Pushing back on that, the observation is made that “real services spending has surged, despite elevated inflation. This is symptomatic of robust demand.” The key risk to watch is (in BofA’s view) not “stagflation,” but a re-acceleration in (services) demand.
Given the large shift in demand from Services to Goods during the pandemic lockdown, I view this shift back towards Services to be part of the post-pandemic normalization.
As Elroy Dimson observed, “Risk means more things can happen than will happen.” That implies we should not panic over every possibility, especially those that are fairly unlikely to happen — and are not showing up in the data…
See also:
Why Investors Love Being Scared, (Michael Batnick, May 14, 2024)
Still No Stag and Not Much ‘Flation (Paul Krugman May 3, 2024)
Previously:
What Does the Misery Index Say About the 2024 Election? (January 25, 2024)
Why the FED Should Be Already Cutting (May 2, 2024)
Transitory Is Taking Longer than Expected (February 10, 2022)
Has Inflation Peaked? (May 26, 2022)
Google searches for “Stagflation”

